locustgrafanastream
Locust Grafana Stream Dashboard
Description
A complete containerized solution for real-time load testing visualization using Locust, Prometheus, and Grafana. This project provides a fully automated monitoring stack with pre-configured dashboards, data sources, and secure networking for comprehensive load testing analysis.
Architecture
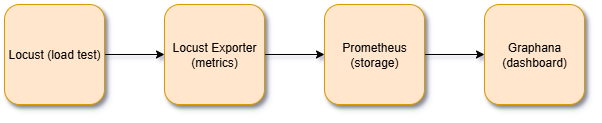
Data Flow:
Locust → Metrics Exporter → Prometheus → Grafana Dashboard
All services run in an isolated Docker network with automatic service discovery and configuration provisioning.
✨ Features
- 🚀 Zero-Configuration Setup: Complete stack launches with a single command.
- 📊 Auto-Provisioned Dashboards: Grafana dashboards and datasources configured automatically.
- 🔒 Secure Networking: Isolated Docker network with proper service communication.
- 🔄 Real-time Monitoring: Live performance metrics during load testing.
- 📈 Production-Ready: Read-only containers with proper restart policies.
- 🎛️ Environment Variables: Configurable admin credentials via environment variables.
- 🐳 Container Optimization: Lightweight, secure container configurations.
Prerequisites
- Docker Desktop installed and running
- Docker Compose v2.0+
- 8GB+ RAM recommended
- Ports 3000, 8089, 9090, 9646 available
Quick Start
-
Clone the repository
git clone <repository-url> cd locustgrafanastream -
Start all services
docker-compose up -d -
Access the applications
- Locust Web UI: http://localhost:8089
- Prometheus: http://localhost:9090
- Grafana: http://localhost:3000 (admin/admin)
- Metrics Endpoint: http://localhost:9646/metrics
🚀 Quick Start
-
Clone and navigate to the project
git clone <repository-url> cd locustgrafanastream -
Start the complete monitoring stack
docker-compose up -d -
Access the applications
Service URL Credentials 🕷️ Locust Web UI http://localhost:8089 N/A 📊 Grafana Dashboard http://localhost:3000 admin/admin 🔍 Prometheus http://localhost:9090 N/A 📈 Raw Metrics http://localhost:9646/metrics N/A -
Start load testing
- Open Locust UI at http://localhost:8089
- Set number of users and spawn rate
- Target host is pre-configured to
jsonplaceholder.typicode.com - Start the test and view real-time metrics in Grafana
📁 Project Structure
locustgrafanastream/
├── Dashboard/
│   ├── dashboard.json                 # Pre-configured Grafana dashboard
│   └── provisioning/
│       ├── dashboards.yml            # Dashboard auto-provisioning config
│       └── datasources.yml           # Prometheus datasource config
├── images/
│   ├── locustgraphanastream.drawio.png # Architecture diagram
│   └── *.png                         # Documentation screenshots
├── load_tests/
│   ├── loadtest.py                   # Locust test scenarios
│   └── __pycache__/                  # Python bytecode cache
├── prometheus/
│   └── prometheus.yml                # Prometheus scraping configuration
├── docker-compose.yml               # Complete stack definition
├── .gitignore                        # Git ignore rules
└── README.md                         # This documentation
🔧 Service Configuration
Locust Load Tester
locust:
  image: locustio/locust
  ports:
    - "8089:8089"
  volumes:
    - ./load_tests/:/mnt/locust
  command: -f /mnt/locust/loadtest.py
  networks:
    - monitoring
  restart: unless-stopped
  read_only: true
Test Scenarios:
GET /posts- Fetch all postsGET /posts/1/comments- Fetch comments for a specific postGET /photos- Fetch all photosGET /todos- Fetch all todosGET /users- Fetch all users
Metrics Exporter
locust-metrics-exporter:
  image: containersol/locust_exporter
  ports:
    - "9646:9646"
  environment:
    - LOCUST_EXPORTER_URI=http://locust:8089
  depends_on:
    - locust
  networks:
    - monitoring
  restart: unless-stopped
  read_only: true
Prometheus Time-Series Database
prometheus:
  image: prom/prometheus:latest
  volumes:
    - ./prometheus/prometheus.yml:/etc/prometheus/prometheus.yml:ro
  ports:
    - "9090:9090"
  command:
    - '--config.file=/etc/prometheus/prometheus.yml'
  networks:
    - monitoring
  restart: unless-stopped
  read_only: true
Scraping Configuration:
- Target:
locust-metrics-exporter:9646 - Interval: 5 seconds
- Job Name:
prometheus_scrapper
Grafana Visualization
grafana:
  image: grafana/grafana:latest
  ports:
    - "3000:3000"
  volumes:
    - grafana_data:/var/lib/grafana
    - ./Dashboard/dashboard.json:/etc/grafana/provisioning/dashboards/dashboard.json:ro
    - ./Dashboard/provisioning/dashboards.yml:/etc/grafana/provisioning/dashboards/dashboards.yml:ro
    - ./Dashboard/provisioning/datasources.yml:/etc/grafana/provisioning/datasources/datasources.yml:ro
  environment:
    - GF_SECURITY_ADMIN=${GF_SECURITY_ADMIN:-admin}
    - GF_SECURITY_PASSWORD=${GF_SECURITY_PASSWORD:-admin}
  depends_on:
    - prometheus
  networks:
    - monitoring
  restart: unless-stopped
  read_only: true
📊 Dashboard Metrics
The pre-configured Grafana dashboard includes:
Performance Metrics
- Response Times: Min, Max, Average, Median, P95, P50
- Request Rate: RPS per endpoint and total throughput
- Content Analysis: Average content length per endpoint
Load Testing Metrics
- User Simulation: Active users, spawn rate, and test status
- Request Statistics: Total requests and request distribution
- Error Analysis: Failure rates, error counts, and error details
System Health
- Service Status: Locust and exporter health indicators
- Endpoint Performance: Per-endpoint performance breakdown
- Real-time Graphs: Live updating time-series visualizations
🛠️ Customization
Environment Variables
# Custom Grafana credentials
export GF_SECURITY_ADMIN=myusername
export GF_SECURITY_PASSWORD=mypassword
docker-compose up -d
Modifying Load Tests
Edit load_tests/loadtest.py:
from locust import HttpUser, task, between

class CustomAPI(HttpUser):
    wait_time = between(1, 3)
    host = "https://your-api.com"

    @task
    def custom_endpoint(self):
        self.client.get("/your-endpoint")
Adding Custom Dashboards
- Create your dashboard in Grafana UI
- Export JSON and place in
Dashboard/ - Update
Dashboard/provisioning/dashboards.ymlto include new dashboard
🔍 Monitoring and Debugging
Health Checks
# Verify all services are running
docker-compose ps

# Check service logs
docker-compose logs locust
docker-compose logs prometheus
docker-compose logs grafana

# View metrics endpoint
curl http://localhost:9646/metrics
Prometheus Targets
Visit http://localhost:9090/targets to verify:
- ✅
locust-metrics-exporter:9646is UP - ✅ Scraping interval is 5s
- ✅ Last scrape was successful
Grafana Data Source
The Prometheus data source is auto-configured with:
- URL:
http://prometheus:9090 - Access: Server (default)
- Scrape Interval: 5s
🚨 Troubleshooting
Common Issues
-
Docker Desktop not running
# Verify Docker is running docker --version docker-compose --version -
Port conflicts
# Check for port conflicts (Windows) netstat -an | findstr "3000 8089 9090 9646" -
Services failing to start
# Check individual service logs docker-compose logs [service-name] # Restart specific service docker-compose restart [service-name] - Dashboard not loading
- Verify Grafana is running: http://localhost:3000
- Check Prometheus connectivity in Grafana → Data Sources
- Ensure dashboard provisioning files are mounted correctly
- No metrics in dashboard
- Start a load test in Locust first
- Verify metrics exporter: http://localhost:9646/metrics
- Check Prometheus targets: http://localhost:9090/targets
Reset Everything
# Stop and remove all containers, networks, and volumes
docker-compose down -v
docker-compose up -d
🏗️ Development
Adding New Services
# In docker-compose.yml
new-service:
  image: your-image
  networks:
    - monitoring
  restart: unless-stopped
  read_only: true
Custom Prometheus Rules
Edit prometheus/prometheus.yml to add:
- New scrape targets
- Custom scrape intervals
- Additional monitoring endpoints
🤝 Contributing
Contributions are welcome! Please:
- Fork the repository
- Create a feature branch (
git checkout -b feature/amazing-feature) - Make your changes
- Add tests if applicable
- Commit your changes (
git commit -m 'Add amazing feature') - Push to the branch (
git push origin feature/amazing-feature) - Open a Pull Request
📏 License
This project is open source and available under the MIT License.
🙏 Acknowledgments
- Locust - Modern load testing framework
- Prometheus - Time-series monitoring system
- Grafana - Observability and visualization platform
- ContainerSolutions - Locust Prometheus Exporter